Licensing information
This graphical, interactive IPM facility (variously called the IPM Report, Pest Mapper and Pest Viewer) is a separately licensed EMu option. Please contact us for licensing information.
EMu's integrated pest management enables institutions to record details about the type and location of traps used to capture pests, what was found in a trap at a given date and time, which objects / specimens in the collection are involved in an infestation, what inspections are planned, and what actions have been taken.
A rich suite of reports for analysing pest trap data is provided, including a sophisticated visualization tool for identifying and tracking infestations within your institution.
Two modules provide pest management support in EMu:
- Traps
Records information about the type and location of traps used by an institution to capture pests.
- Pest Events
Records details about what was found in a trap at a given date and time, which objects / specimens in the collection are involved in an infestation, what inspections are planned, and what actions have been taken.
A comprehensive set of reports provides graphical data about the prevalence of pests within your institution.
The two modules and a range of Excel Pivot Table reports are included in the EMu Art and EMu Museum clients by default. They are available to all other clients on request and at no additional cost.
EMu's Integrated Pest Management facility also includes a powerful, web-based tool for visualizing your pest data on interactive maps and floor plans of your institution.
To run an IPM report:
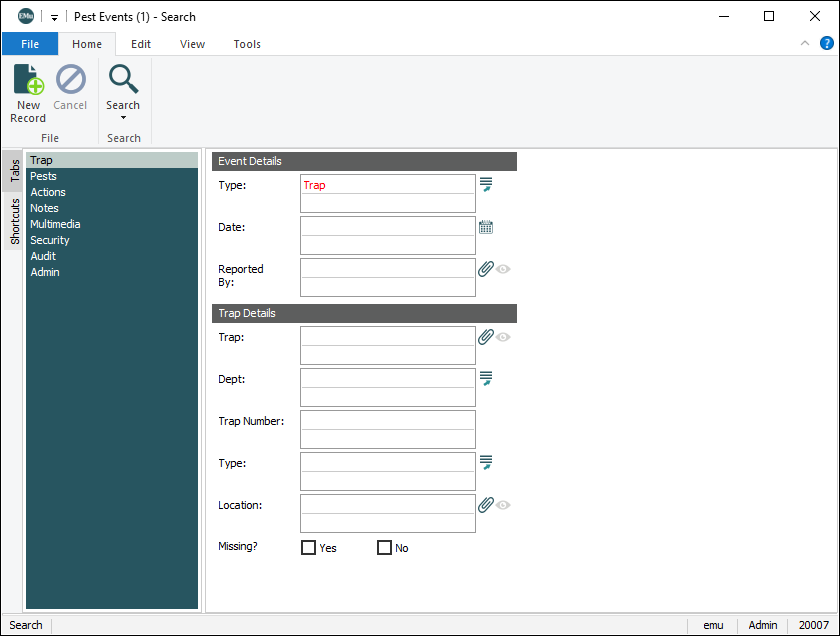
- Search for records in the Pest Events module.
Search by date range, trap, location and / or pest:
- From the Ribbon, select Home>Reports.
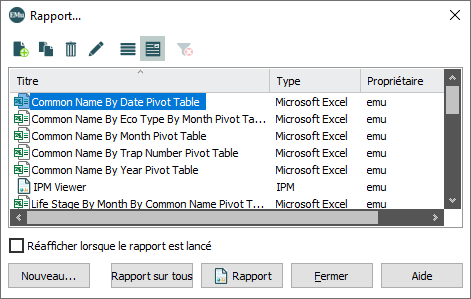
The Reports box displays with a list of pre-configured Excel Pivot Table reports and (if you have a licence for the IPM facility) the IPM Report:
Note: The
IPM Reportmay be named differently in your EMu system. - Select a report, e.g. Common Name By Date Pivot Table.
- Click Report to generate the report using the current L'enregistrement actuellement affiché en Vue de Détails ou mis en évidence en Vue de Liste (il est entouré d'une légère ligne pointillée). On ne peut avoir qu'un seul enregistrement en cours à la fois. record or selected Une notice sélectionnée a été choisie soit seule ou parmi un groupe d'enregistrements. Il est habituel de sélectionner les enregistrements que vous souhaitez voir affectés par une opération avant d'effectuer celle-ci. Les enregistrements sélectionnés sont utilisés dans de nombreux cas, par exemple lorsque l’on souhaite les rejeter, les sauvegarder dans un groupe ou les attacher à un autre enregistrement. Un enregistrement sélectionné s'affiche à l'écran avec un fond bleu lorsqu'il est en vue de liste. records
-OR-
Click Report All to generate the report using all listed records.
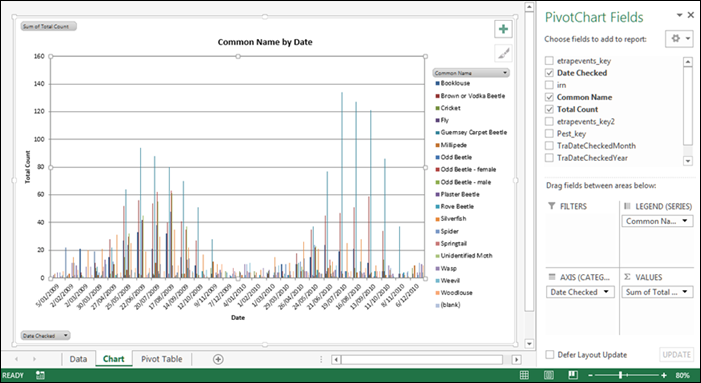
In this case, MS Excel will open with various tabs holding:
- Raw data
- A Pivot Table
- A chart - a graphical representation of your data along with various filtering options:
Note: EMu's Integrated Pest Management facility also includes a powerful, web-based tool for visualizing your pest data on interactive maps and floor plans of your institution. This graphical, interactive IPM facility (variously called the IPM Report, Pest Mapper and Pest Viewer) is a separately licensed EMu option. See The IPM Report: a graphical, interactive visualization tool for details.